


The EHS-to-Finance Translator: How to Turn Operational Metrics Into Financial Impact
May 5, 2026
EHS success is financial success. The problem is that most EHS leaders can’t prove it in language finance understands, and have trouble advocating for themselves in budget conversations as a result.
Often, this will boil down to two factors.
The first is tactical: EHS teams lead with activity metrics — training completions, near-miss counts, corrective actions closed — when finance is listening for exposure, payback periods, and return on investment.
The second is harder to fix. Scott Gaddis, a veteran EHS leader who has spent years navigating executive conversations, puts it this way: “An EHS person goes into a room talking very passionately about the things that we know down here in our gut are the right things to do, but you’re never going to win, especially a big capital project, from a source of passion — unless something catastrophic has already happened.”
The irony is that EHS professionals often have exactly the instincts finance needs. They:
- Can see risk accumulating before it becomes an incident.
- Know which hazards are one bad day away from a recordable.
- Understand, intuitively, how to prevent the costs that finance worries about, and
- Are far more likely to get the resources their programs need, if they can articulate the above three points.
It’s worth being clear about why this translation matters because the financial case is often the only path to the resources that keep people from getting hurt.
Behind every lagging indicator is a person who didn’t go home the way they came in. Behind every open corrective action is a hazard that someone will eventually encounter. When EHS leaders make the financial argument well, they earn the investment that prevents the human cost from accumulating in the first place.
This article gives EHS leaders a practical framework for making that translation. We’ll look at five operational priorities — hazard identification, audits and inspections, near-miss reporting, corrective action closure, and training completion — and show how to reframe each one in terms finance actually responds to.
How to make a case that finance cares about
Are you finance-ready? Win your next budget conversation with a quick checklist for EHS leaders who must justify program investment in financial terms. Get the checklist
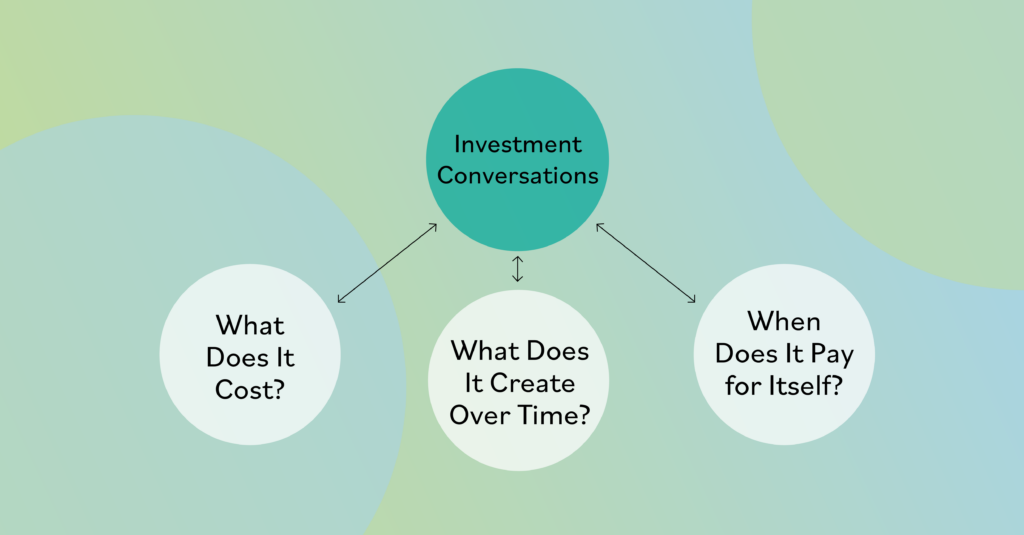
Every executive conversation about investment is ultimately driven by three questions:
- What does this program cost?
- When does it pay for itself?
- And what does it create over time, in today’s dollars?
Most EHS budget conversations get stuck on the first question and never reach the other two.
There are a few different ways to address these questions. Focus on ROI and cost avoidance where possible. There’s also a case to be made for harder-to-quantify ‘soft ROI,’ particularly around regulatory and legal compliance. Here’s what each of those look like.
ROI
ROI covers the direct and indirect costs of incidents.
Direct costs are easiest: medical expenses, workers’ compensation, regulatory fines, litigation.
Indirect costs are where EHS teams typically lose the thread: lost productivity, overtime to cover absent workers, retraining, equipment damage, morale impacts, accelerated turnover. These are real costs, even if they don’t show up cleanly on a balance sheet.
A useful starting point is to look at what the incident disrupted:
- How many hours of overtime were logged to cover the absent worker?
- How long did the investigation pull supervisors off the floor?
- Did equipment need repair or replacement as a result?
Even rough estimates give finance something to evaluate.
Cost avoidance
Cost avoidance is a trickier argument, but it’s often the most effective for EHS teams.
A prevented incident doesn’t generate a loss, which means it doesn’t generate a line item — the savings are invisible. The way to make them visible is to look backward: What did similar incidents cost last year? What would it cost if those same incidents happened again? That delta is what a program is worth.
Scott describes how most EHS teams operate: “80% of the time, you are going into that room with senior leaders on cost avoidance. You’ve noticed a problem, you know you can fix it, and the cost avoidance part is, ‘What does it do to reduce risk to the company?’”
‘Soft ROI’ and legal/regulatory framing
Not every argument will be fully quantifiable, and that’s worth acknowledging, too. In addition to ROI and cost avoidance, finance typically responds to legal and regulatory framing, even when a precise dollar value isn’t available.
This is sometimes called soft ROI: the improvements in efficiency, risk visibility, and organizational resilience that don’t show up cleanly on a balance sheet but represent real value nonetheless.
Angelo Cianfrocco, an EHS solutions consultant at Intelex, has written a useful primer on how to build that case if you want to go deeper on that side of the argument.
Leading vs. lagging indicators

Most executives judge EHS performance through lagging indicators: total incident rate, DART rate, days away from work. These metrics are not always accurate, and from a financial perspective, they can be actively misleading.
Consider two plants with identical total incident rates.
The first had a handful of minor injuries. The second had two serious back injuries, each costing hundreds of thousands of dollars in workers’ comp, lost time, and retraining. Same TIR, but radically different financial exposure. A CFO making resource decisions based on incident rate alone is looking at the wrong number.
Scott spent years trying to shift his own executive team away from this reflex: “They had been so trained and so normalized that TIR and DART rate was how you judge success — it took me years to change that.” By the time a lagging indicator moves, something has already gone wrong, and money has already been spent.
Leading indicators work differently.
They measure the conditions that produce incidents — hazards identified, audit findings closed, near misses reported — rather than the incidents themselves. They give EHS and finance visibility into risk while there’s still time to act on it, which is also when acting is cheapest.
The five priorities in the framework below are built around those leading indicators.
Are you finance‑ready? Grab the quick checklist built for EHS leaders who need to make a clear, numbers‑driven case for their next budget. Get the checklist
How to translate EHS priorities into financial terms (Framework)
For each EHS priority, the structure is the same:
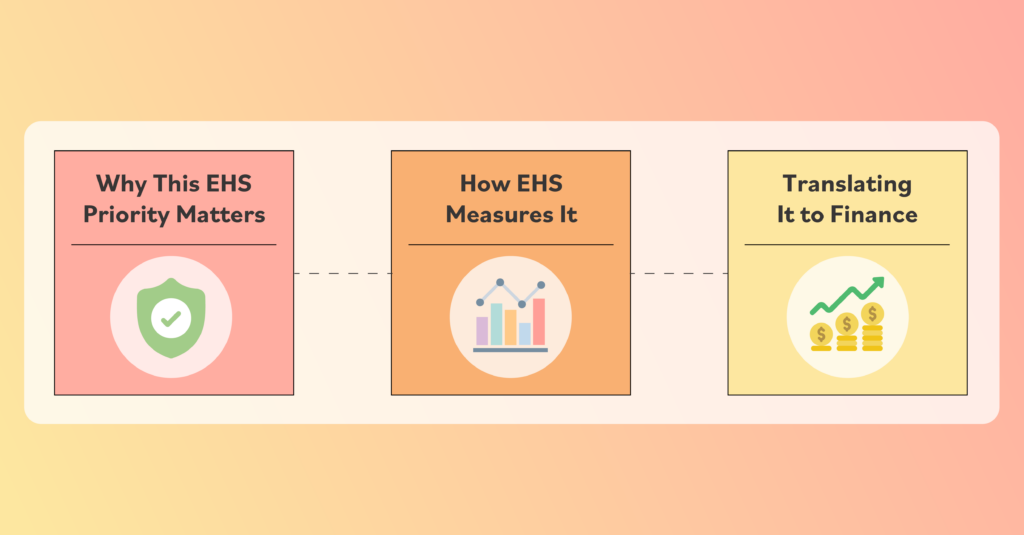
- Why it matters for safety and operations
- How EHS teams measure it, and
- How to translate that into terms finance can evaluate.
These priorities are ordered from most to least proactive, starting where EHS has the most leverage to prevent harm — and the strongest cost avoidance argument — and moving toward the reactive end of the spectrum.
Priority one: Hazard identification
Why it matters
Hazard identification is where EHS has the most leverage, and where the case for proactive investment is most direct.
It’s the earliest possible intervention — surfacing risk before an incident, a near miss, or an audit finding has occurred. For finance, that timing matters: The earlier a hazard is identified, the cheaper it is to resolve.
An unidentified hazard is an unknown risk. The organization doesn’t know it exists and can’t act on it. An identified but unaddressed hazard is a known risk. The organization is now aware of it and has a documented obligation to respond.
That visibility creates legal accountability as well as financial exposure, which is why a mature hazard identification program is relevant not just to EHS and operations but to general counsel and the CFO.
How EHS measures it
- Volume of hazards identified, including near misses and observations
- Trends over time, broken down by site, task, or activity type
- Severity or risk ranking of identified hazards
- Percentage of identified hazards that have been addressed or mitigated
Translating to finance
The financial angle is risk discovery and cost prevention. Each hazard identified represents a potential incident that didn’t happen, along with all of its associated direct and indirect costs.
Earlier identification almost always means cheaper resolution: A guardrail installed before an injury costs a fraction of what that injury would cost in medical bills, lost time, investigation, and litigation.
A mature hazard identification program also reduces financial volatility. Organizations that rely on lagging indicators to find problems are, by definition, waiting for something bad to happen before they act.
Every serious incident carries a cost distribution that’s hard to predict: A back injury can cost $5,000 or $500,000, depending on severity and duration. Catching hazards before they become incidents evens that distribution considerably.
In practice, the financial framing might sound like this: “We identified 47 hazards this quarter across three sites. Based on our average recordable incident cost of $42,000 in direct expenses alone, resolving those hazards before they escalate represents a significant reduction in our exposure, even if only a fraction of them would have resulted in an incident.”
Finance doesn’t need the math to be perfect. Avi Kamboj, Intelex CFO, advises, “Put some dollar behind it, and at least it’ll get the discussion going, versus just getting a complete no.”
Not fully finance-ready yet? Strengthen your next budget conversation with a practical checklist designed for EHS leaders who must justify investment in financial terms. Get the checklist
Priority two: Audits and inspections
Why it matters
Where hazard identification surfaces individual risks, audits and inspections surface systemic ones: weaknesses in processes, unsafe conditions, and compliance gaps that a single observation might miss.
For finance, audits and inspections are the mechanism by which known risk gets documented and assigned an owner.
An audit finding that takes 90 days to close represents 90 days of documented, known exposure. If an incident occurs during that window and an open finding exists, the legal and financial consequences are material.
That’s the core argument for investing in tools and processes that accelerate audit cycles and finding closure — not just that audits are good practice, but that slow audits are expensive.
How EHS measures it
- Number of audits and inspections completed
- Findings categorized by risk level
- Time from finding identification to closure
- Rate of repeat findings — the same issue appearing across multiple audits
That last metric is particularly useful for financial conversations. A repeat finding is evidence of a systemic failure that has already been identified and hasn’t been fixed. The longer it goes unaddressed, the more the associated risks compound, and the harder it becomes to defend the organization’s position if an incident occurs.
Translating to finance
Audits and inspections translate into three financial frames: regulatory exposure, litigation risk, and industry benchmarking.
On regulatory exposure, the math is often straightforward. If an unresolved audit finding puts the organization in violation of a specific regulatory standard, EHS can look up what fines that violation carries and present it as quantified exposure.
On litigation, a documented audit and inspection program provides evidentiary protection. In the event of a serious incident, the question of whether or not the organization knew about a hazard and acted on it has significant legal consequences. This form of ‘soft ROI’ will be very real to a CFO and general counsel.
Scott also points to a third angle that often goes unused: estimating costs based on what peer organizations have actually experienced.
“You can look within your vertical and see somebody doing the same type of activities,” he says. “You can look across the road and say, ‘Company X suffered a fatality last year doing these activities. And we have those activities.’’ Known cases from comparable organizations give finance a concrete basis for estimating exposure, beyond the regulatory penalty schedule.
Intelex’s Audit Management tools track findings from identification to closure, assign ownership automatically, and flag repeat issues, giving EHS the documentation trail that matters in regulatory reviews and legal proceedings.
Priority three: Near-miss reporting
Why it matters
Hazard identification and near-miss reporting are related but distinct. Hazard identification is a proactive, systematic search for conditions that could cause harm. Near-miss reporting captures what that search missed: situations that made it all the way to the point of potential harm before someone flagged them. Together, they give EHS visibility across the full spectrum of risk.
Near-miss reporting also functions as a cultural signal in a way that hazard identification doesn’t.
- A high volume of near-miss reports is evidence that workers trust the system enough to flag problems. A low volume, in a facility where incidents still occur, often means the opposite: Workers don’t believe reporting will lead to anything, so they don’t bother. For finance, that distinction matters because it speaks to the maturity and reliability of the EHS program as a whole.
How EHS measures it
- Volume of near-miss reports over time
- Trends by site, shift, task, or activity type
- Time from report submission to resolution
Translating to finance
The instinct is to lead with the rate: “Near-miss reporting increased 18% this quarter.” Resist that instinct.
Near-miss stats have a tendency to be misinterpreted by people outside EHS; a high volume of reports could be read as evidence of an unsafe workplace rather than a healthy safety culture.
Lead with context before the number.
The figure that matters to finance is what each report represents in avoided cost.
A more effective framing: “We’re catching hazards before they become incidents. Last year, our recordable incidents cost approximately $X in direct costs alone — and that doesn’t count investigation time, retraining, and production downtime. A mature near-miss program is how we drive that number down systematically, rather than waiting for something to go wrong and reacting to it.”
To put a number to it, take the average cost of a recordable incident from your own historical data or industry benchmarks, then estimate conservatively how many of the near misses your program identified and resolved could have escalated.
Intelex’s Near Miss Reporting and Observations tools make it easy for frontline workers to report hazards on the spot via mobile. EHS teams get trend lines and leading indicators, connected directly to corrective action workflows.
Priority four: Corrective action closure
Why it matters
An open corrective action is an unresolved risk, and the gap between identification and closure is where organizations remain exposed. For finance and legal, that gap has a cost:
It’s the period during which the organization has documented awareness of a problem it hasn’t fixed.
The metrics EHS uses to track corrective action closure measure how long that exposure lasts and how much of it remains.
- Closure speed tells you how quickly exposure is resolved once it’s been identified and documented.
- Closure rate tells you how much of the known risk pool is actually being eliminated.
Both matter, and they can be misleading in isolation.
A 95% closure rate looks good until you know the 5% remaining open includes the highest-severity findings. A corrective action closed in 120 days represents four months of known exposure that didn’t have to exist. If an incident occurs while a related corrective action is sitting open, the organization has a record showing it knew about the problem, which changes the conversation with regulators and plaintiffs’ attorneys considerably.
How EHS measures it
- Rate of corrective action closure
- Average time to close by severity level
- Percentage closed within target timeframe
- Recurrence rate — incidents or findings that share a root cause with a previously closed corrective action
Translating to finance
The financial case starts with a simple question: What did unresolved findings cost us last year?
If the organization has historical data showing incidents that were preceded by an open corrective action — a recurring equipment issue that was flagged but never fixed, a process hazard that sat in the queue for months — those incidents already have a dollar value attached to them: direct costs, lost productivity, investigation time. That’s the baseline.
The argument to finance is the delta: “In [year], we had X incidents directly linked to a previously unresolved corrective action. Each cost approximately $Y in direct costs and Z days of lost productivity. A disciplined closure process costs far less than that.” That’s a concrete, defensible business case.
The second argument is less quantifiable but matters equally to a CFO or general counsel. A documented, timely corrective action process is evidence that when the organization identifies a problem, it acts on it. In a regulatory audit or litigation, the question of whether the organization knew about a hazard and fixed it carries significant legal and financial consequences.
Avi puts the CFO’s version of that calculus plainly: “I don’t want a multi-million dollar lawsuit coming my way. If I could spend $150K on something that will help me reduce that and keep people working, that’s probably more beneficial.”
Intelex automatically assigns corrective action ownership, tracks items to closure, and links each action back to the originating incident or audit finding, giving EHS and finance a clear line of sight from problem to resolution.
Priority five: Training completion
Why it matters
Training completion establishes the baseline from which everything else in an EHS program operates. When workers receive consistent training across roles, sites, and shifts, task variability decreases, unsafe acts are reduced, and expectations are standardized.
For finance, the primary argument is compliance and liability: If an incident occurs and training records show gaps, the organization’s legal and regulatory position is considerably weaker.
That said, Scott is direct about where training completion sits in the hierarchy: “Training completion is a coverage metric, not a leading indicator of risk reduction. Its value is realized only when paired with stronger signals like near-miss reporting, audits, and corrective action closure.” Present training completion rates as supporting context, not a headline metric.
How EHS measures it
- Training completion rate by role, site, or task
- Coverage gaps — who hasn’t been trained
- Refresher cadence for high-risk activities
Translating to finance
The financial case for training is primarily a compliance and liability baseline argument. Consistent training across roles and sites reduces the operational variability that contributes to incidents and ensures the organization can demonstrate due diligence if it faces regulatory scrutiny or litigation.
To put a number to it, look at what other organizations in your industry have paid when insufficient training was a contributing factor — regulatory penalty databases and published case settlements are a reasonable starting point. Even a rough figure gives finance something to evaluate.
The argument isn’t “training completion drove down our incident rate.” It’s: “Consistent training reduces variability, ensures every role is covered, and means we can defend our position if we ever face regulatory scrutiny or litigation.” That’s a narrower claim than the ones available for hazard identification or near-miss reporting, but it’s an honest one, and finance will respect the distinction.
Intelex automatically tracks training completion by role and site, flags coverage gaps, and connects training records directly to incident data, making it straightforward to demonstrate due diligence and identify where gaps in coverage may be creating exposure.
Walking into the room: Practical guidance

How EHS leaders structure and present their case matters as much as the underlying data. Regardless of the specific program you’re presenting, a few principles apply across the board.
Lead with risk, close with numbers. Finance understands exposure framing even when the dollar figure isn’t precise. Open with the risk, then give them something to calculate with.
Use benchmarks, but get specific. Industry averages are a starting point. Avi’s advice: “You don’t need to get into exact science, but a bit more tailored: In our peer group, we’ve seen this happen, and that’s why I think it’ll be beneficial. If you’re too high level, you’ll miss the mark.” Your own historical data will always be more persuasive than an industry figure.
Quantify the cost of the current process. One of the most underused arguments in EHS is the cost of manual processes. An EHS manager earning $50 an hour who spends four hours per week pulling training reports manually is spending roughly $10,000 a year on a single administrative task. That’s a real number finance can evaluate.
Show trends, not snapshots. A single quarter’s data is a data point. Three quarters of consistent improvement is a trend. Finance trusts trends.
Your next budget conversation is coming soon. Are you finance-ready? Use this checklist to confidently justify EHS program investment in the financial language decision-makers expect. Get the checklist
The translation is the strategy
The programs EHS teams run — hazard identification, audits and inspections, near-miss reporting, corrective action closure, and training — are the mechanisms by which organizations avoid the kinds of incidents that cost millions of dollars, disrupt operations, and generate regulatory and legal exposure. That value is real. The challenge has always been making it legible to a financial audience.
Scott puts the core problem clearly: “You have to reframe EHS talk in the terms of business talk. That’s really where we fail.”
The reframe isn’t complicated, but it takes discipline. Lead with exposure, not activity. Attach dollar estimates to risk, even imprecise ones. Show the trend, not just the number. And build credibility slowly, one accurate projection at a time, so that when the larger ask comes, the groundwork is already laid.
EHS leaders who can do that will be better positioned to get the resources that make workplaces safer.
Ready to see how Intelex can help you build the data foundation for these conversations? Personalize your demo and explore the tools built for EHSQ teams making the case to finance.