


Using the Fishbone Diagram in Intelex for Root Cause Analysis
July 16, 2024
Environmental Health and Safety (EHS) management is important for any organization. The Fishbone Diagram, also known as the Ishikawa Diagram, is a useful tool for this. It helps identify the root causes of issues. Dr. Kaoru Ishikawa developed this method in the 1960s for quality management. Today, it is commonly used in many practices, including EHS.
Fishbone Diagrams, available in Root Cause Analysis Software, help identify the possible causes of workplace incidents in a clear way. This makes it easier to follow safety rules and work together as a team. Using this tool helps create plans that lead to lasting improvements.
Table of Contents
- What is a Fishbone Diagram
- Identify root causes of workplace incidents using a Fishbone Diagram
- Benefits of Fishbone Diagram
- How to use a Fishbone Diagram for root cause analysis
- Practical example
- Step-by-step guide to set up a Fishbone Diagram in Intelex
- Advantages of using Intelex for EHS management
What is a Fishbone Diagram?
A Fishbone Diagram is a visual tool used to find the possible causes of a specific problem.
It’s called a Fishbone Diagram because it looks like a fish skeleton. The problem is written at the “head” of the fish, and the causes are listed as “bones” that spread out from the spine.
Identify Root Causes of Workplace Incidents Using a Fishbone Diagram
Fishbone Analysis in EHS management helps find the root causes of workplace injuries and accidents. Whether it’s a major accident, a near-miss, or a hazard, understanding why it happened is key to stopping it from happening again.
The Fishbone Diagram helps ensure all potential causes are considered, leading to a complete look at the problem.
Read more about incident reporting best practices in our guide The Five Things You Need To Know About Incident Management and Reporting.
Benefits of Fishbone Analysis in EHS
Fishbone Analysis has several key benefits in EHS management:
- Clarity in Problem-Solving: The visual layout of causes and effects makes it easier to understand and address complex problems.
- Comprehensive Analysis: The structured format ensures that all possible causes are looked at, leading to a complete analysis.
- Improved Safety and Compliance: By identifying and fixing root causes, organizations can improve safety protocols and follow safety regulations better.
- Enhanced Collaboration: Fishbone Analysis encourages team participation, leading to more effective problem-solving and decision-making.
Enhancing problem-solving capabilities
Fishbone Analysis makes problem-solving easier by providing a clear, organized way to break down complicated issues.
This method helps EHS professionals and teams focus on the most important areas to fix, ensuring that every possible cause is considered. It leads to better solutions and helps make sure nothing important is missed.
Improving compliance and safety standards
Complying with safety standards is a key part of EHS management, and understanding the causes of problems is required by many safety regulations.
Fishbone Diagrams help organizations follow these rules by finding and solving the root causes of safety issues. This helps improve safety protocols and creates a safer workplace.
Facilitating team collaboration and brainstorming
Fishbone Analysis makes it easier for teams to work together and brainstorm.
The diagram gives everyone a visual way to share their thoughts, making it simpler for team members to communicate their ideas. This teamwork leads to a better understanding of the problem and helps find better solutions.
How to Use a Fishbone Diagram for Root Cause Analysis
Using Root Cause Analysis Software, you can create a Fishbone Diagram with the following steps:
1. Identify the problem statement (effect): Start by clearly stating the problem you want to analyze. The problem statement should be simple and direct.
2. Draw the backbone and main categories: Draw a horizontal line (the fish’s spine) with an arrow pointing to the problem. Then, draw branches off the spine to represent main categories of potential causes. These categories usually include:
- People: Human factors such as training, skills and behavior.
- Methods: Procedures and processes.
- Machines: Equipment and tools.
- Materials: Raw materials and consumables.
- Environment: Physical and environmental conditions.
- Measurements: Data and measurement systems.
3. Add Potential Causes: For each main category, add possible causes. Use brainstorming sessions to gather input from team members.
4. Analyze and Document Findings: Review the diagram to find the most likely root causes. Then, prioritize the causes based on how likely they are to happen and how much impact they will have. Create an action plan to address the root causes.
Want to explore other root cause analysis tools? Get a copy of our Basic Safety Toolbox report to explore more tools like 5 Whys and TapRoot to create a safer, more resilient workplace.
Example of Using Fishbone Diagram to Identify the Root Cause
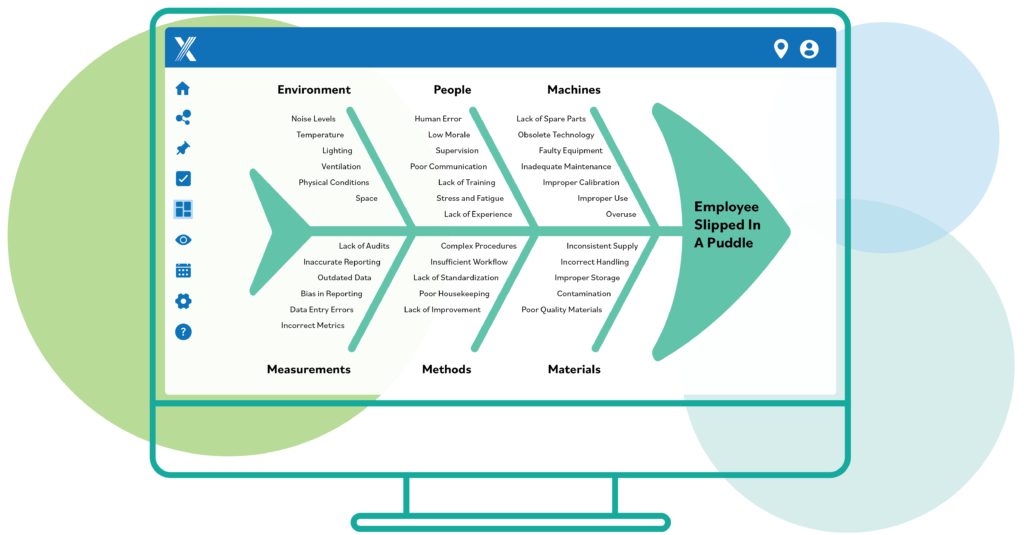
Let’s look at a hypothetical accident in a workplace. Suppose an employee slips and falls in a manufacturing plant. Here’s how a Fishbone Diagram could help identify the root causes:
1. Problem statement: “Employee slipped in a puddle of liquid while walking down a pedestrian aisle, injuring their left hip.”
2. Draw the backbone and main categories:
- People: Lack of training, human error, lack of supervision, lack of experience, fatigue, stress, poor communication or low morale.
- Methods: Poor cleaning schedules, messy work spaces, unclear safety procedures.
- Machines: Obsolete technology, improper use, faulty equipment, inadequate maintenance, lack of spare parts, overuse or improper calibration.
- Materials: Poor quality materials, improper storage, inconsistent supply, incorrect handling or contamination.
- Environment: Temperature, lighting, noise levels, ventilation, space or physical conditions.
- Measurements: Inaccurate reporting, outdated data, incorrect metrics, data entry errors, lack of audits and inspections or bias in reporting.
3. Add potential cause: Here are some causes you might find:
- People: Insufficient safety training, failure to follow protocols for cleaning spills, stress to complete a job task.
- Methods: Ineffective cleaning schedules, poor housekeeping and unclear safety procedures.
- Machines: Leaking machine past its service life, inadequate maintenance and capital investment plan to replace equipment.
- Materials: Improper storage of material in the pedestrian aisle.
- Environment: Dimly lit areas, cluttered walkways or uneven floor surface.
- Measurements: Lack of regular housekeeping inspections or inadequate maintenance equipment checks.
4. Analyze and document findings:
- Review the diagram to identify the most likely root causes.
- Prioritize these causes based on their impact and likelihood.
- Develop action plans to address and mitigate these causes.
Using Intelex for Fishbone Diagrams
Intelex is a software platform for EHS management that helps you create and manage Fishbone Diagrams. It allows for real-time collaboration, integrates with other EHS tools, and generates reports automatically, making it an ideal choice for EHS professionals.
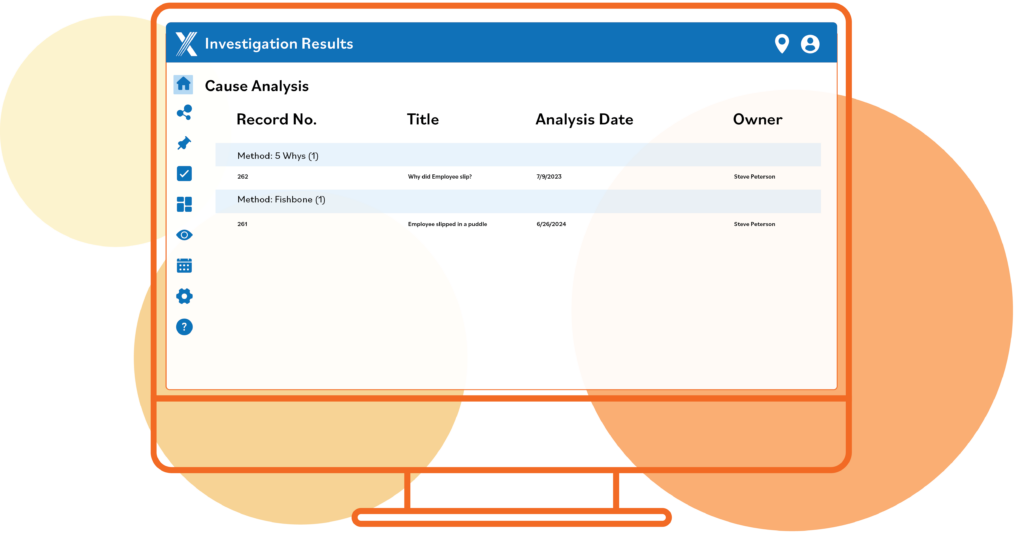
Step-by-step guide to setting up a Fishbone Diagram in Intelex
Log into Intelex:
- After logging in, navigate to the problem-solving or root cause analysis module.
Entering the Problem Statement and Main Categories:
- Enter the identified problem statement in the designated field.
- Add the main categories of potential causes (People, Methods, Machines, Materials, Environment, Measurements).
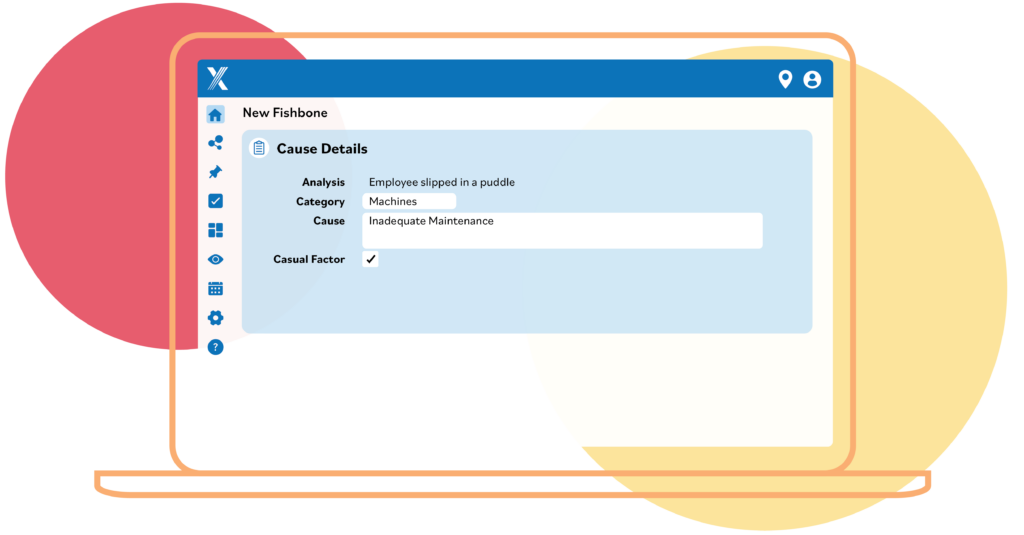
Adding and Organizing Potential Causes:
- For each main category, add specific potential causes.
- You can use drag-and-drop to organize the causes visually.
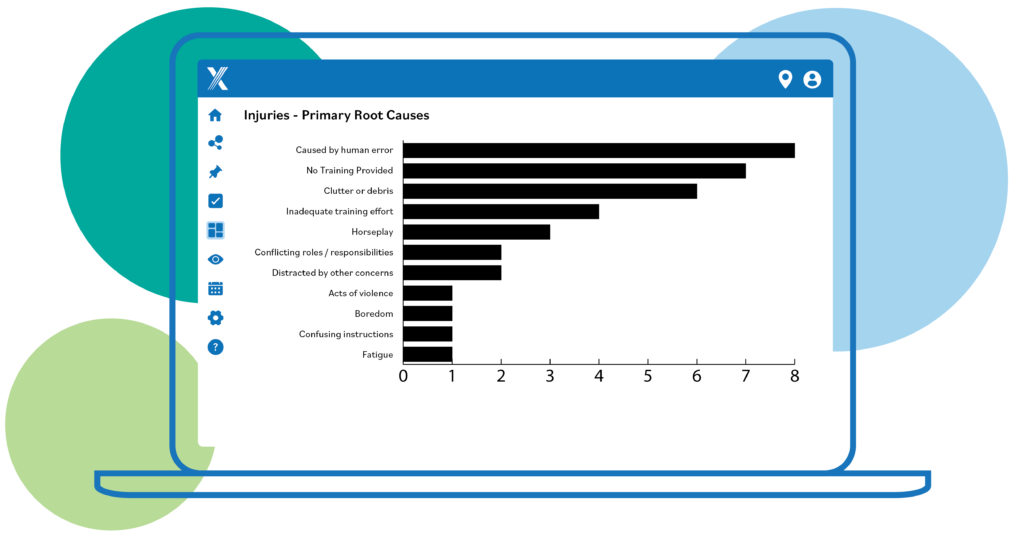
Analyzing and Documenting Findings:
- Use Intelex’s tools to analyze the data, like scoring the severity and likelihood of each cause. Then, use the Risk Matrix tool to understand the identified causes better.
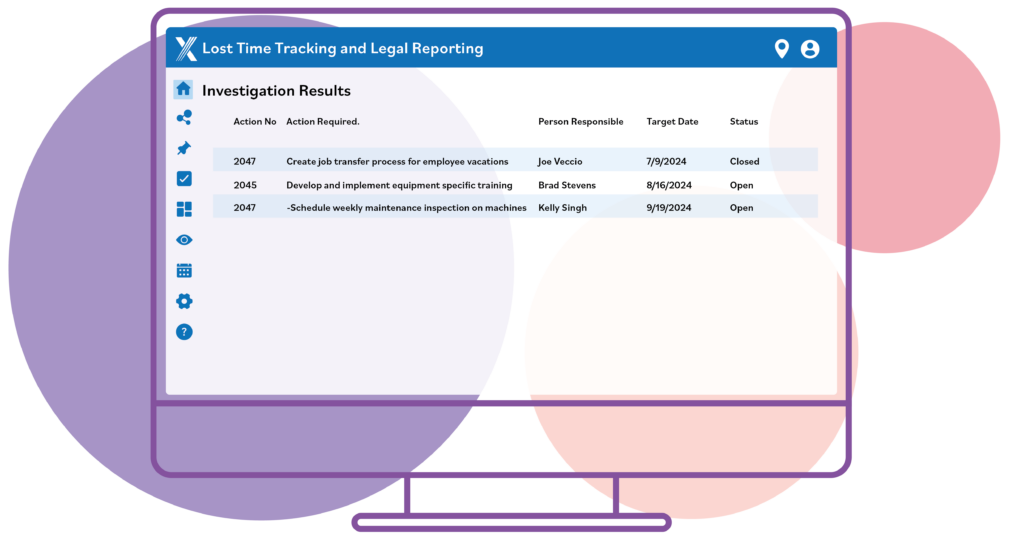
- Document your findings and create action plans within the software.
- Generate automated reports for sharing with the team and stakeholders.
Advantages of Using Intelex for EHS Management
Intelex makes Fishbone Analysis easier by offering these advantages:
- Integration with other EHS tools: Link your root cause analysis with other EHS management modules, like incident management, action planning, inspections and audits.
- Real-time collaboration: Enable team members to collaborate in real-time, enhancing the quality and speed of problem-solving.
- Automated reporting: Create reports automatically to save time and ensure accuracy.
Conclusion
Fishbone Analysis is a powerful tool in EHS management. It helps identify and solve the root causes of workplace problems in a structured way. Using Fishbone Diagrams improves safety, compliance and teamwork. Intelex makes this process even easier by offering tools for creating and managing Fishbone Diagrams, collaborating with teams and automating reports.
To see how Fishbone Analysis can improve your EHS practices, try Intelex today. Its tools offer a simple and effective way to find and fix root causes, making your workplace safer and more compliant.
See Intelex in action: Create a custom demo playlist and see how our solutions can transform your EHS and ESG management!