


What Is Risk Management? Transforming Workplace Safety with Data-Driven Insights
January 21, 2022
What can be done today to prevent worker injuries and deaths tomorrow? The answer lies in effective risk management, which involves identifying hazards, evaluating their potential dangers and estimating the likelihood of harmful incidents. Regulatory bodies universally require employers to conduct risk assessments, as these evaluations are fundamental in protecting the health and safety of workers and others.
However, a significant challenge in this process is accessing and consolidating the necessary data, which is often spread across multiple business systems and stored in varying formats. Through innovative technology, organizations can identify the key factors behind workplace incidents and implement effective prevention strategies.
Anticipating Hazards in the Workplace through Proactive Safety
Rather than merely reacting to incidents that have already occurred, EHS leaders should focus on anticipating and forecasting potential hazards. This proactive approach is central to effective risk management. By utilizing leading indicators—such as near-misses, safety audits and observations—organizations can identify early warning signs and implement prevention strategies before any harm occurs.
In contrast, lagging indicators are retrospective and provide data on events that have already occurred. These include metrics such as injury rates, lost workdays and incident reports. While lagging indicators are crucial for understanding past performance and identifying trends, they do not offer the same opportunities to prevent future incidents as leading indicators do.
By combining both leading and lagging indicators, organizations can create a balanced approach to risk management. Leading indicators help in anticipating and mitigating risks, while lagging indicators provide context and validation for the effectiveness of safety measures. Understanding the difference between these two types of indicators allows organizations to implement a more comprehensive safety strategy, ensuring that hazards are not only responded to but also proactively prevented.
Data Collection Challenges in Risk Management
Effective risk management relies heavily on accurate data collection and analysis. However, one of the biggest challenges in this process is that data is often spread across multiple business systems, making it difficult to access and consolidate. Additionally, inconsistencies in data syntax and quality further complicate the ability to standardize and interpret this information.
As the importance of data-driven decision-making continues to grow, so does the need for precise data in EHS management. According to Columbia Southern University’s report, 4 Trends in Occupational Safety and Health to Expect in 2021, leveraging safety data for predictive modeling is becoming increasingly vital. This modeling enables businesses to anticipate potential hazards and identify conditions that may increase the likelihood of incidents. To stay competitive, companies are increasingly adopting machine learning-powered safety software, such as Intelex, which is designed to provide real-time analytics and insights that can be used to prevent incidents before they occur.
The Value of the Risk Assessment
A risk assessment is used to identify and evaluate hazards found in a work environment before incidents happen, determine the level of danger in those hazards and assess the likelihood of harm occurring. Risk hazards need to be evaluated with criteria that help to build a credible understanding of what is and is not acceptable. Most regulatory bodies require some form of risk assessment of hazards, and all follow a similar template that includes:
- Identifying risks to the worker associated with work activity. This may include:
- Observe workplace activities, tasks, processes and substances for potential hazards.
- Review past accidents and health records to uncover hidden risks.
- Check manufacturers’ data sheets, instructions and guidance.
- Consult with employees involved in the tasks for their insights.
- Group hazards into five categories: physical, chemical, biological, ergonomic and psychological.
- Identifying hazards found in the work environment that pose a threat of loss. It is not necessary to list people by name, rather by identifying group, such as:
- Employees vs Contractors
- Younger vs Older Workers
- New Hires
- Lone Workers
- Expectant Mothers
- Providing details of identified risks or hazards and context to build understanding, including:
- Duration and frequency of exposure
- Type of equipment and its condition
- Training and competency of workers
- Environmental conditions, such as light or ventilation
- Presence or absence of safety signage
- Accessibility of Personal Protective Equipment (PPE)
- Utilizing a risk matrix (see more below) to understand and determine precautions. Consider the following:
- Severity – The degree or amount of expected loss
- Likelihood – How likely that the loss will occur
- Risk Rating – The probability and severity of the risk before and after control actions are taken
- Establishing controls (more below) that protect people and the work environment. Some examples are:
- Regular inspection and maintenance
- Installing guardrails and safety barriers
- Establishing clear signage
- Maintaining proper lighting
How to Build a Risk Matrix
A risk matrix is a great assessment tool for evaluating and estimating risk levels. It helps to judge whether the hazard and possible risk are acceptable, scores it and then plots findings on a matrix chart to ultimately determine the level of control required to reduce the risks and mitigate incidents. If the activity rating rises above acceptable levels, then controls are warranted to lower scores.
For every hazard identified during an inspection and for each associated activity, it’s important to ask the question “what if?” What could be the worst-case outcome regarding a hazard or concerning activity? Is it a fatality, significant injury, permanent disability or health effect? Is it a minor injury, an environmental concern or something that could cause damage? A risk matrix is a tool to judge the likelihood and severity of harm.
Use our Risk Matrix Designer to create risk profiles that include probability, frequency and potential severity to manage risk in your organization.
Below is an example.
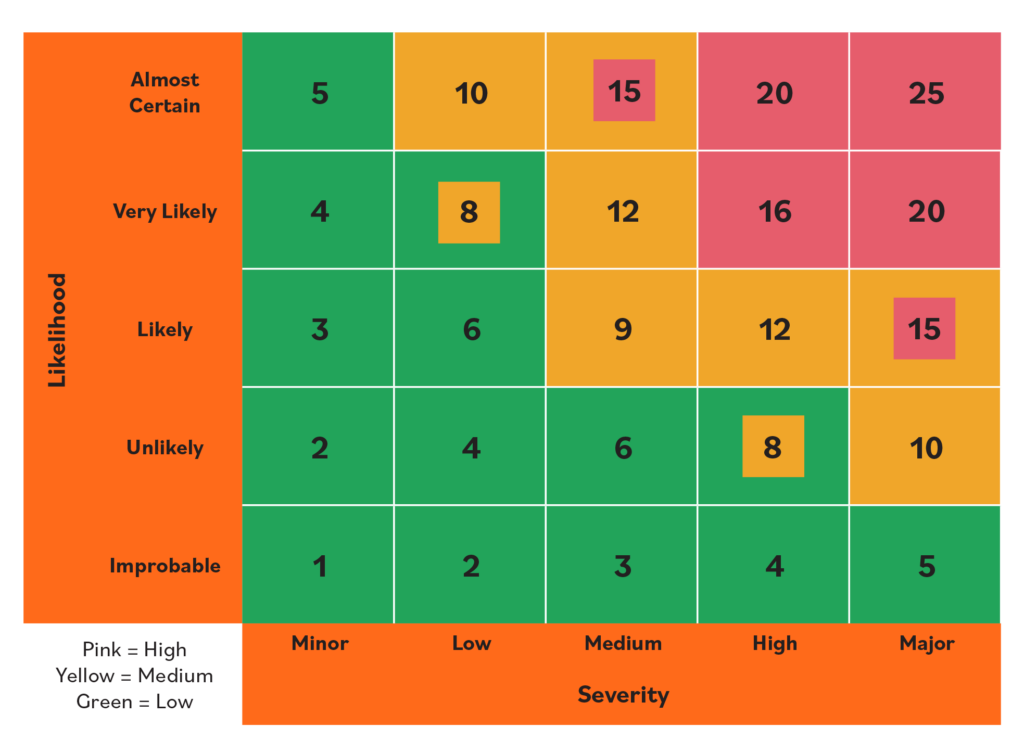
A five-point (5×5) matrix estimate the likelihood (probability) and severity (consequence) within the five descriptive levels (below).
Likelihood scale
| Rating Score | Qualitative Element | Definition |
| 0 | Impossible | No injury or illness, damage or other loss is possible. |
| 1 | Improbable | Loss, injury or illness could only occur under freak conditions. The situation is well managed, and all reasonable precautions have been taken. |
| 2 | Unlikely | This situation is generally well managed. However occasional lapses could occur. This also applies to situations where people are well trained and required to behave safely to protect themselves. |
| 3 | Likely | Insufficient or substandard controls in place. The loss is unlikely during normal operation however, it may occur in emergencies or non-routine conditions. |
| 4 | Very Likely | Serious failures in management controls exist. The effects of human behavior or other factors could cause an accident but are usually supported by this additional factor (e.g., ladder not appropriately secured, process upset, oil spilled on the floor, poorly trained personnel). |
| 5 | Almost Certain | Absence of management controls. If conditions remain unchanged, there is nearly 100 percent certainty that an accident will happen (e.g., broken rung on a ladder, live exposed electrical conductor). |
Severity scale
| Rating Score | Qualitative Element | Definition |
| 0 | None | No injury or illness, damage, sickness or other loss is possible. |
| 1 | Minor | Minor injury, illness or loss is possible (e.g., light cuts, scratches, insignificant damage to property). |
| 2 | Low | Significant injuries or illnesses are possible (e.g., sprains, bruises, lacerations and events needing medical care). Damage to property or process. |
| 3 | Medium | Temporary disability is possible (e.g., fractures, finger amputation). Lost workdays due to injury or illness; substantial damage or loss of property or process. |
| 4 | High | Permanent disability is possible (e.g., significant loss of movement, loss of limb, sight or hearing) |
| 5 | Major | Causing death to one or more people. Loss or damage is such that it could cause serious business disruption (e.g., major fire, explosion or structural damage). |
The Hierarchy of Controls for Job Safety
The hierarchy of controls is a structured approach that prioritizes the most effective safety measures at the top and gradually progresses to less effective measures. This hierarchy is crucial for managing workplace hazards, with the goal of reducing risks to the lowest possible level. The hierarchy is composed of five levels: elimination, substitution, engineering controls, administrative controls and PPE.
Intelex Vice President of Health and Safety, Scott Gaddis, describes it as a simple-to-understand process that’s useful in gauging the control appetite of an organization. It should serve as an overarching methodology for how to deliver the right level of program control for job safety and job hazard management.
An example from Gaddis’s report, Walking-Working Surfaces and Pedestrian Safety, offers a methodology for creating a control hierarchy – in this case for walking-working surfaces risks – and highlights the most effective controls, emphasizes engineering solutions, reveals administrative controls and the necessary reliance on personal protective equipment (see below).
| Ranking | Control | Control Feature | Example of Control |
| Most effective | Elimination | Completely eliminate the hazard | – Removing a hazardous chemical entirely from a manufacturing process and replacing it with a non-hazardous one. |
| Substitution | Reduce a hazardous situation, component, material, and/or piece of equipment that does not have the same level of hazard. Substitution often requires significant changes and can be difficult to implement. | – Install slip-resistant flooring – Improve material handling practices to reduce personnel movement outside localized workspace. | |
| Engineering | Isolate people from an identified hazard or risk. While this control is viewed not as protection as elimination or substitution, this focus still controls exposure at the source of the hazard. | -Install guard barriers to separate pedestrians and material handling equipment. – Stop contamination from getting to the walking-working surface. – Improve illumination in walking areas. | |
| Administrative | Take steps to follow and support safe work practices by altering the way workers perform their work and reduce risks they have on the job. | – Update safety policies, rules, supervision, schedules and training. | |
| Least effective | PPE | Protection worn by a worker for protection or to reduce loss threshold from a hazard. | – Slip-resistant footwear – Cut-resistant gloves – High-viz clothing |
Conclusion
Effective risk management is not just about meeting regulatory requirements—it’s about proactively safeguarding the well-being of workers by anticipating and mitigating potential hazards. Through the strategic use of leading vs lagging indicators, risk matrices and the control of hierarchies, organizations can move beyond reactive measures and create safer work environments. By overcoming challenges in data collection and leveraging predictive modeling, businesses can identify risks before they materialize, ensuring that prevention strategies are both targeted and effective.
Ultimately, the goal is to build a comprehensive safety strategy that not only addresses existing hazards but also continuously improves processes to prevent future incidents. As the workplace evolves, so too must our approach to risk management, embracing both traditional methodologies and innovative technologies to protect the most asset of any organization—its people.